
Why Defensive Structures in the Super Lig Deserve Serious Attention
If you watch Turkish football regularly, you’ve probably noticed how wildly different teams defend, even at the top of the table. Some sides sit deep and compress space, others press like crazy, and a few do something in between. Analyzing the defensive structures of top Super Lig teams isn’t just about “who conceded fewer goals”. It’s about understanding how they control space, manage risk and shape the rhythm of the game. When done right, Super Lig defensive analysis stats become more than just numbers — they turn into a story about how a team survives pressure, wins second balls, and forces opponents into low‑quality chances instead of clear one‑on‑ones.
Step 1: Get Clear on What “Defensive Structure” Really Means
Before jumping into clips and dashboards, you need a working definition. Defensive structure is not only about the back four or back three; it’s the coordinated behavior of the entire team when they don’t have the ball. That includes the shape of the first pressing line, the compactness of midfield, how fullbacks adjust to wingers, and what the last line does with depth. In the context of the Turkish Super Lig, where games can swing from cagey to chaotic in minutes, understanding structure means recognizing how quickly teams can shift from a mid‑block to a low block, or from passive pressing to aggressive traps on the wings.
Key components of defensive structure
At a basic level, break the concept down into several elements that you can track consistently across matches. This helps you move from vague impressions like “they defend well” to precise descriptions. To keep your notes consistent, focus on:
– Base formation and how it morphs out of possession (e.g., 4‑2‑3‑1 becoming 4‑4‑2 in defense)
– Line height (high press, mid‑block, low block) and distances between lines
– Roles of fullbacks and defensive midfielders in protecting half‑spaces and central zones
Common misconception to avoid
A frequent beginner’s mistake is to equate defensive structure with “parking the bus”. In reality, some of the best defensive teams in Turkish Super Lig actually press high and defend far from their own goal. They might allow more shots than a low‑block side, but the shots are often from poor locations. When you do Super Lig match analysis and predictions, don’t focus only on total shots conceded; try to see whether the structure of the team forces bad decisions and low‑quality attempts instead of panicking about every effort from 25 meters.
Step 2: Collect the Right Defensive Data (Without Drowning in Numbers)
You don’t need a full club‑level data department to do meaningful analysis, but you do need to be selective. The point of using football data analytics for Super Lig clubs or for your own analysis is to filter the chaos, not to smother yourself with charts you don’t understand. Start with a narrow set of metrics and pair them with video. Over time, you’ll see which stats actually match what your eyes tell you and which ones are just noise influenced by game context, like red cards or late chasing.
Core defensive metrics to track
When you’re building your own mini “Super Lig tactical analysis service” workflow, pick a small number of indicators that highlight quality rather than just quantity. For a beginner, the following categories are usually enough to get meaningful insights without confusion:
– Goals conceded and xG against (quality of chances allowed, not just volume)
– PPDA or similar pressing metrics to gauge how aggressively a team defends up the pitch
– Zone‑based stats: where do opponents complete passes, enter the box, and take shots from?
Expert tip: Context over raw numbers
Data analysts working with top clubs often stress the same point: never look at stats in isolation. A defender in a dominant team might face far fewer attacks but more dangerous counters, while a defender in a mid‑table side deals with regular waves of pressure. Many Super Lig defensive analysis stats are heavily shaped by game state. If a leading team drops into a low block for the last 20 minutes every week, their metrics will look different from a side constantly chasing equalizers, even if both are equally organized defensively.
Step 3: Use Video to Connect Numbers and Real‑World Behavior
Once you’ve skimmed the numbers, you must turn to the pitch. Video is where defensive structure becomes tangible. Instead of watching the ball like a fan, lock your attention on lines, distances, and triggers. The goal is to see whether the data about pressing or shot locations makes sense once you visualize how the team is actually moving. Over a few games, patterns emerge: when they press, where they sag off, and how they respond when the first line is bypassed.
How to watch a Super Lig match with a defensive lens
Try to rewatch at least one game per team with the pause button ready. At dead‑ball moments, freeze the frame and look at the shape. Over time, you’ll train your eye to notice details that casual viewers ignore. A simple three‑pass sequence by the opponent can reveal positional habits that repeat throughout the season.
– Pause when the opposition center‑backs have the ball under no pressure
– Observe the spacing between the defensive and midfield lines
– Note how wingers position themselves: do they protect inside lanes or stay wide on fullbacks?
Expert recommendation: Track “what happens next”
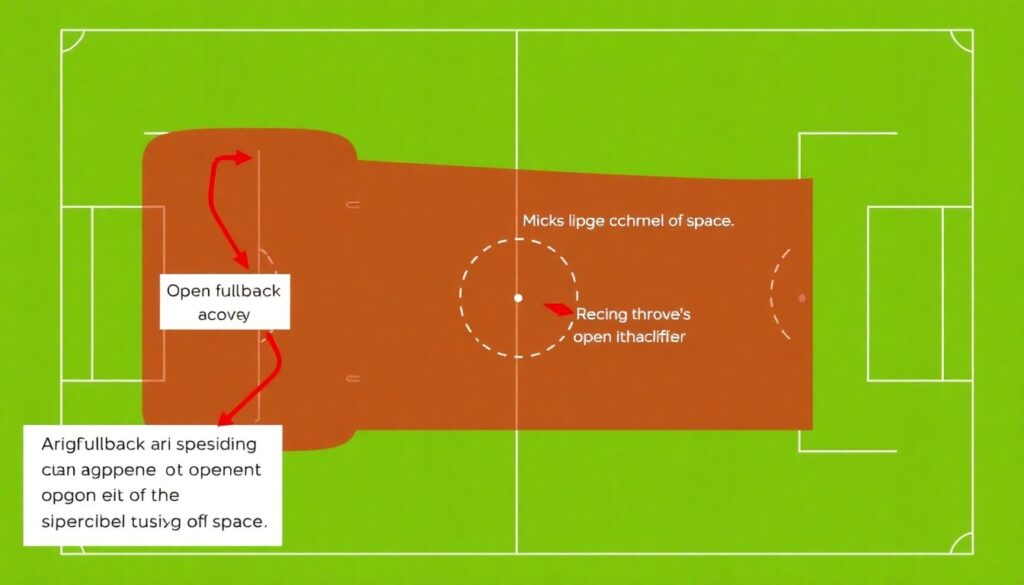
Experienced analysts suggest you don’t just log what the shape is; you also log what immediately follows. For example, when the right fullback steps out to press, does someone slide across to cover the channel behind him? If not, that’s a recurring structural weakness. When you later compare this to shot maps, you may find many chances come from that same corridor. That’s how you move from abstract criticism (“they leave space behind the fullback”) to evidence‑based conclusions that hold up under scrutiny.
Step 4: Break Down Defensive Phases Step by Step
To really understand top Super Lig teams, treat defense as a sequence of phases. Teams don’t defend the same way in all zones; what they do near the opponent’s box will differ from what they do near their own. Segment your analysis into three main phases and evaluate each one separately. This method mirrors what many professional analysts use when preparing reports for coaching staffs and recruitment teams.
Phase 1: High press and first line of defense
Start by examining how the team behaves when the opposition begins building from the back. Are the forwards aggressive, cutting off passing lanes to the pivot? Does a midfielder jump up to support? Pay attention to pressing triggers: back passes, poor first touches, or passes to the touchline. Some of the best defensive teams in Turkish Super Lig use very specific triggers to spring into action, rather than running blindly at center‑backs. If those triggers are clear and coordinated, the side can win the ball high and prevent long defensive spells in deeper zones.
Phase 2: Mid‑block and control of central spaces
When the press is beaten or intentionally dropped, the mid‑block becomes critical. This is where structure is most obvious: how compact the team stays between lines, whether the pivot shields central spaces, and how the wide midfielders or wingers manage half‑spaces. As you watch, ask yourself: is the opposition forced to the wings? Do they struggle to receive between the lines with their No. 10? When your Super Lig defensive analysis stats suggest that opponents attempt more low‑value crosses than central entries against a team, that’s often a clue that their mid‑block is well organized and steering danger away from high‑probability zones.
Phase 3: Low block and box protection
Eventually, every team ends up defending close to its own box. This is where many matches in Turkey are decided, especially against sides that overload the wings and look for cutbacks. Study how the back line and midfield collapse into the area. Notice whether the defenders attack crosses proactively or simply track runners reactively. A well‑drilled low block will have clear roles: some players attack the ball, others screen the cutback zone, and at least one midfielder hovers to win second balls around the D. Good defensive structure doesn’t just block the initial shot; it controls what happens after the first clearance.
Step 5: Compare Top Teams Without Falling for Lazy Narratives
Once you’ve analyzed a few top Super Lig sides, the temptation is to say “Team X defends better because they conceded fewer goals.” That’s too simplistic. Instead, compare how they defend across contexts: at home vs away, in big matches vs weaker opponents, and when leading vs trailing. Compare not only the goals and xG against, but also the types of chances conceded. Some teams tolerate frequent low‑danger shots from range; others allow fewer, but from prime central areas.
What to look for in cross‑team comparisons
Instead of making sweeping claims, pick a few specific criteria. For example, you might focus on how different contenders defend transitions or crosses. Frame your analysis around questions, then answer them with a mix of video and data. This approach keeps you grounded and also aligns with how many scouting departments structure their internal reports over a season.
– How quickly does each team recover into shape after losing the ball?
– Which side defends the half‑spaces more aggressively, especially against No. 10s?
– Who better controls the box against wide overloads and aerial threats?
Expert warning: Beware of small sample sizes
Analysts inside clubs constantly remind people that a few matches don’t define a team. A top side might have one awful afternoon with injuries, red cards, or freak goals, and the metrics from that game can distort your overall picture. When you build Super Lig match analysis and predictions, try to use at least a 10‑match sample for structural conclusions. One or two games are fine for spotting potential issues, but not for declaring a system “broken” or “elite”.
Step 6: Blend Data and Expert Insight Like the Pros
The real value of professional‑level analysis lies in combining numbers with informed interpretation. That’s why many clubs invest in both data departments and experienced video scouts. Think of data as a flashlight that shows you where to look more closely, and of expert opinion as the filter that distinguishes random variance from recurring patterns. If you want to approximate what a Super Lig tactical analysis service does, adopt a workflow where stats, clips and notes are constantly cross‑checked.
What expert analysts focus on in practice
People who do football data analytics for Super Lig clubs usually mention a few non‑negotiables. They obsess over repeatable patterns, not highlight‑reel moments. They watch how the team reacts when their first plan fails: when the press is broken, when a fullback is beaten, when a center‑back steps out and misses. Their interest is less about individual errors and more about whether the system supports players or leaves them exposed. Over time, these experts can tell whether a team’s good defensive record is sustainable or heavily dependent on keepers having outstanding games.
Expert recommendations for improving your own analysis
Experienced staffers often advise independent analysts and aspiring scouts to build consistent routines rather than chase trendy metrics. They suggest picking a fixed set of defensive indicators, tracking them across several rounds, and annotating them with notes from video. They also insist on documenting context in your reports: injuries, formation changes, fixture congestion, even weather conditions if they clearly influence the match. When you later revisit your work, those small details help you understand why a team’s structure looked stable one month and shaky the next.
Step 7: Practical Tips for Beginners (And Pitfalls to Avoid)
If you’re new to analyzing the defensive structures of top Super Lig teams, it’s easy to get overwhelmed. There’s a lot going on: tactics, data, individual form, and the chaotic nature of some games. Treat this as a long‑term learning process rather than a test you must pass this weekend. The more matches you watch with a defensive lens, the more natural this will become, and the less you’ll rely on surface‑level narratives about “weak back lines” or “solid defenses”.
Beginner‑friendly advice
To keep yourself on track and avoid common traps, follow a few straightforward rules. They may sound simple, but consistently applying them is what separates casual observers from people whose opinions coaches actually respect. Over time, these habits also help you spot underlying trends earlier than the table does.
– Start with one team and follow them for 5–6 matches before comparing across the league
– Use just a handful of key metrics at first: goals conceded, xG against, PPDA, shot locations
– Write brief post‑match notes about shape, pressing, and box defense instead of relying on memory
Typical mistakes to watch out for
A big error is judging structure purely by results or single incidents, like a late equalizer from a set piece. Sometimes the system works well for 89 minutes and fails once due to a lost duel, not a structural flaw. Another trap is ignoring the role of game state: a team chasing a goal will naturally open up and concede more transitions. When you look at Super Lig defensive analysis stats, always ask yourself whether you’re seeing the true system or an emergency mode forced by the scoreboard. Keeping that distinction in mind will make your evaluations far more realistic and useful.
Bringing It All Together
Analyzing the defensive structures of top Super Lig teams is mostly about building a repeatable method. You identify what you want to observe, select supportive data, and then validate everything through video. Over time, you’ll naturally develop a sense of which sides are structurally solid and which ones lean too heavily on individual brilliance to bail them out. When someone asks which are currently the best defensive teams in Turkish Super Lig, you won’t just quote goals conceded; you’ll be able to explain how they press, how they protect the box, and why their system is likely to hold up under pressure across a long season. That’s when your analysis stops being guesswork and starts to resemble the work professionals do on a daily basis.